Python debugging — how to find errors without losing your mind
Python debugging is one of the most important skills nobody teaches you directly in first year. You know how to write code, but when something goes wrong, and it always goes wrong, you don’t know where to start looking.
In this article I’ll explain how to debug Python using the three tools I use most: Thonny, Python Tutor and the VS Code debugger. We’ll also cover the three types of errors that appear most in FP1 and how to identify them quickly.
Table of Contents
What is debugging?
Debugging (from the English word “bug”) is the process of finding and fixing errors in your code. A bug is anything that makes your program not work as expected, it can be an error that crashes the program or a silent incorrect result that goes unnoticed.
There are three types of errors you’ll encounter constantly in FP1:
Syntax errors (SyntaxError)
The code is written incorrectly and Python can’t even run it. These are the easiest to find because Python tells you exactly which line has the problem:
# Typical SyntaxError — missing : at the end of if
if x > 5
    print("greater")
SyntaxError: expected ':'
Type errors (TypeError, ValueError)
The code has correct syntax but at some point you try to do something with the wrong data type:
# TypeError — adding text to number
age = input("Age: ")
new_age = age + 1    # input() returns str, not int
TypeError: can only concatenate str (not "int") to str
Silent errors
The most dangerous type. The program runs without errors but the result is incorrect. Python doesn’t warn you because technically there’s no error — the logic is simply wrong:
# Silent error — missing parentheses in the average
average = grade1 + grade2 + grade3 / 3    # only divides grade3 by 3
# Incorrect result but no error message
For this third type debugging tools are most important, there’s no error message to guide you.
Tool 1 — Thonny
Thonny is the editor used in FP1 class. It has a very intuitive visual debugger that’s perfect for beginners. To debug in Thonny:
Open your file in Thonny and instead of clicking the normal play button (F5), click the Debug button, the bug icon. This runs the program step by step.
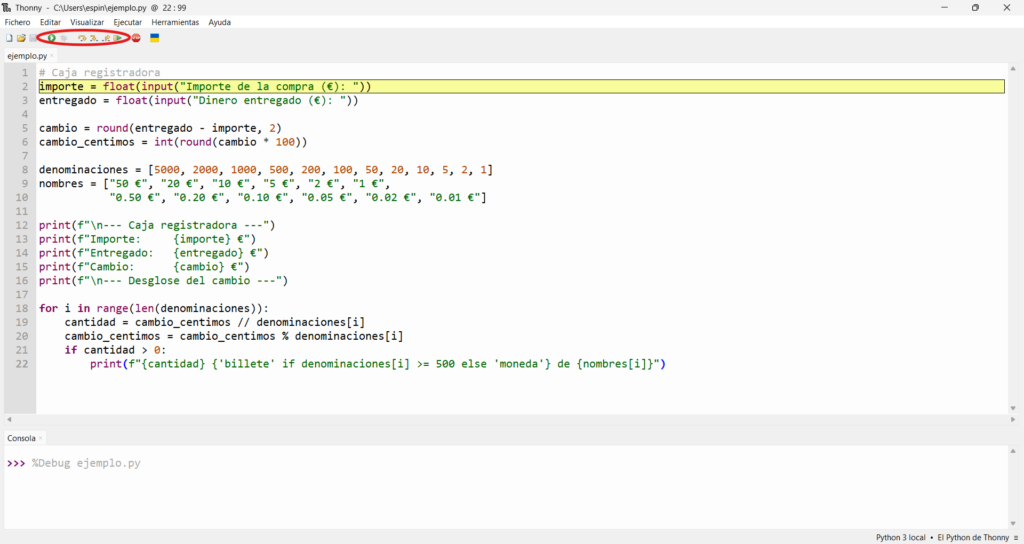
With the program in debug mode you have these controls:
Step Over (F6) — executes the current line and moves to the next. Use it to advance line by line watching how the variables change.
Step Into (F7) — enters inside a function to see what it does internally.
Step Out (F8) — exits the current function and returns to the main code.
The most useful thing in Thonny is the Variables panel on the right side (open it from the View menu), it shows in real time the name, type and value of every variable as the program advances. It’s the most visual way to see exactly what’s happening.
Tool 2 — Python Tutor
We’ve already mentioned Python Tutor in previous articles because it’s perfect for visualising how Python manages memory. To debug with it:
Go to pythontutor.com, paste your code and click “Visualize Execution”. You’ll see the code with an arrow indicating which line is currently executing, and on the right all objects in memory with their values.
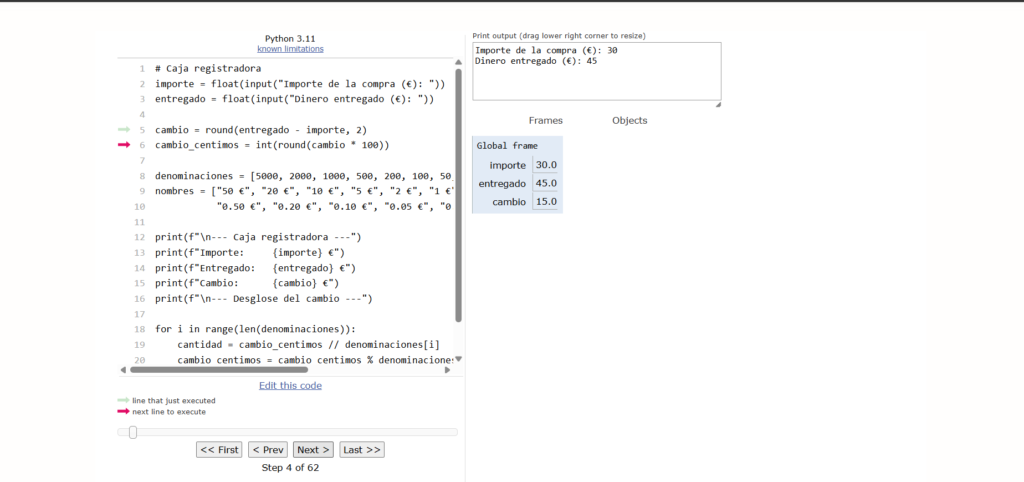
It’s especially useful for understanding silent errors, you can see exactly what value each variable has at each moment and detect exactly where the logic goes wrong.
One important thing: Python Tutor doesn’t support input(). While debugging, replace it with fixed values:
# Instead of:
grade1 = float(input("Grade 1: "))
grade2 = float(input("Grade 2: "))
grade3 = float(input("Grade 3: "))

# Use these fixed values for debugging:
grade1 = 7.5
grade2 = 8.0
grade3 = 6.0
This way Python Tutor can step through your code without needing user input.
Tool 3 — The VS Code debugger
I didn’t know VS Code had a built-in debugger until recently, and it’s very powerful. To use it:
Open your .py file in VS Code and click on the line number where you want the program to pause — a red dot called a breakpoint will appear.
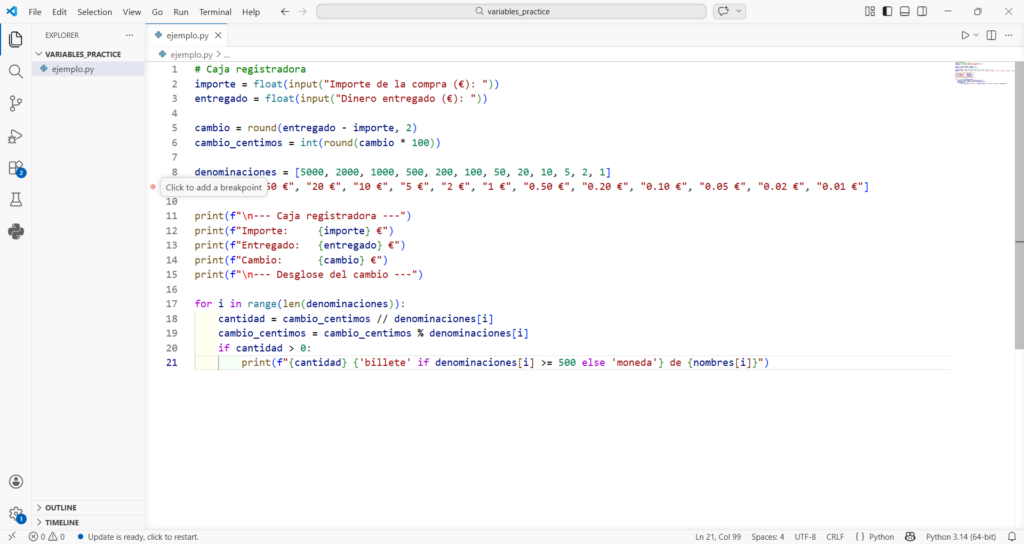
Then press F5 or go to Run → Start Debugging. The program will run until it reaches the breakpoint and pause there.
In the left panel you’ll see:
Variables — all active variables with their current values.
Watch — you can add expressions to monitor. For example grade1 + grade2 shows you the result of that sum in real time.
Call Stack — shows which function you’re currently inside at each moment.
The debugging controls work the same as Thonny:
F5  → Continue until next breakpoint
F10 → Step Over (next line)
F11 → Step Into (enter function)
F12 → Step Out (exit function)
My debugging workflow in practice
After using these tools throughout FP1, this is the order I follow when something goes wrong:
Step 1 — Read the full error message. If Python gives an error, I read the whole thing, especially the last line which tells me the error type and the line number. I don’t search Google before reading the complete message.
Step 2 — Google the exact error. I copy the error message exactly and search for it. 99% of first-year errors are already solved on Stack Overflow.
Step 3 — Add strategic prints. If there’s no error but the result is wrong, I add temporary print() statements to see variable values at key points:
grade1 = 7.5
grade2 = 8.0
grade3 = 6.0

print(f"Debug: grade1={grade1}, grade2={grade2}, grade3={grade3}")
average = grade1 + grade2 + grade3 / 3
print(f"Debug: average={average}")  # here you see the error
# Output: Debug: average=17.5  ← wrong, should be 7.17
Seeing 17.5 instead of 7.17 tells you immediately that only grade3 is being divided by 3, not the whole sum. The fix: average = (grade1 + grade2 + grade3) / 3.
Step 4 — Use Python Tutor or Thonny. If the prints don’t reveal the problem, I open Python Tutor to step through line by line and see exactly where the logic breaks.
Step 5 — Use the VS Code debugger. For longer or more complex programs, the VS Code debugger with breakpoints is more comfortable than Python Tutor.
Most common error messages in FP1
Save this table — it will save you time searching Google:
# SyntaxError: expected ':'
# → Missing : at the end of if, for, while or def

# IndentationError: unexpected indent
# → Incorrect indentation — check your spaces and tabs

# TypeError: can only concatenate str (not "int") to str
# → Adding text and number — convert with int() or float()

# ValueError: invalid literal for int() with base 10
# → Trying to convert non-numeric text to a number
# → Example: int("hello") gives this error

# NameError: name 'x' is not defined
# → Using a variable before declaring it or with wrong name

# ZeroDivisionError: division by zero
# → Dividing by zero — add if b != 0 check before dividing
Summary — when to use each tool
SyntaxError or TypeError     → read the message + Google
Silent error in short code   → Python Tutor
Silent error in long code    → VS Code debugger with breakpoints
Learning a new concept       → Thonny in step-by-step debug mode
First line of defence always → strategic print() statements
In the next topic, control structures, debugging becomes more important because silent errors in if/elif/else and loops are harder to detect.